We believe you can go further and do more when you have a trusted risk-discussion partner on your team, who will look at your business holistically to uncover new opportunities.
We are a leading global reinsurer that helps insurance companies reduce their earnings volatility, strengthen their capital and grow their businesses through reinsurance solutions.
Severe Convective Storm Burning Cost – Too Hot, Too Cold?
SHARE
Steffen Münch, Catastrophe Researcher, discusses how the Burning Cost approach to calculating the expected loss from Severe Convective Storm to US Property reinsurance programs has value, but also pitfalls that should be taken into account, especially if the program is a high excess-of-loss or aggregate excess-of-loss layer of a geographically focused regional portfolio.
Building the burn
The Burning Cost (BC) is the annual average of all reported losses to the insurer’s portfolio (or layer) from a recent period, such as the last 5, 10 or 20 years. The BC (after losses are trended, see box below) indicates the expected loss to the program for the coming contract year. This approach is accurate for perils that result in a high frequency of losses per year (frequency perils).
Trending reported losses. Before calculating the BC, corrections must be made to reported losses to reflect the current portfolio (exposure growth or contraction) and claims costs (e.g., repair cost and house price inflation). The importance of trending becomes clear when it’s considered that US Severe Convective Storm (SCS) losses have almost doubled on average since 2010 due to inflationary pressures. The loss history is also checked to ensure that no events are missing (e.g., were below the insurer’s past loss reporting threshold for the layer in question).
However, SCS is not purely a frequency peril
As we highlighted in our last Quick Reads article on SCS, The Third Dimension of Tornado Clustering, tornadoes don’t just cluster in space and time, they also cluster in intensity – these infrequent, extreme SCS events may or may not have impacted a specific regional portfolio in recent years, but they have the potential to do so and indeed will have done so, just not within the relatively short BC reporting period. What’s more, these extreme events have a wide potential impact area: given the right meteorological conditions, extreme intensity-cluster outbreaks can occur everywhere in the US between the Rockies and Atlantic Coast – they are not constrained to the Great Plains and Southeast where most tornadoes are observed.
As we show below, whether or not an extreme event is included as part of a reported loss history will make the BC either too hot (i.e., too high, over-estimating the risk) or too cold (i.e., low, under-estimating the risk), with regional portfolios showing the most variation.
The chosen BC years matter. Example, Alabama
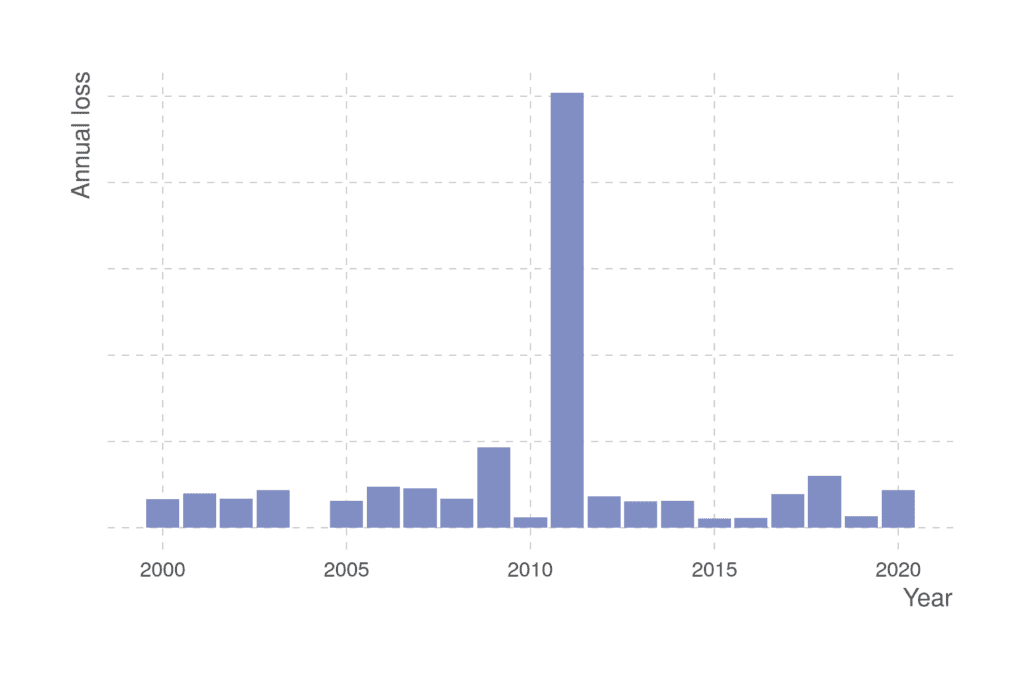
The April 25-28, 2011 tornado outbreak is the most extreme tornado intensity-cluster event from recent history, leading to insured losses of over USD 10 billion (trended, all US)1. For Alabama, for example, the 2011 annual total loss of approximately USD 5 billion2 dramatically stands out compared to all other years in the 2000-2020 period (figure 1).
Figure 1: PCS annual total industry losses (USD) trended to 2022 for the state of Alabama only, 2000-2020.Source: PCS and PartnerRe2.
Whether or not the losses from the April 2011 event are included in a BC calculation has a significant influence on the BC. For example, the 2011-2020 Alabama industry BC is approximately USD 900 million, whereas the 2012-2021 Alabama BC is approximately USD 300 million2.
BC c.f., the model view
So, which of the two industry BC values for Alabama is the most reliable? According to our proprietary CatFocus® US Severe Convective Storm model, see box below, the long-term (i.e., the basis of any sustainable risk estimate) Annual Expected Loss (AEL) for Alabama is approximately USD 750 million (with a 38% contribution to the AEL from events with return periods (RP) greater than 10 years, a commonly used BC period, see figure 2a). Depending on the chosen BC reporting period, the BC therefore either over- or underestimates Alabama’s SCS risk.
PartnerRe’s proprietary CatFocus® US Severe Convective Storm model includes a 10,000-year modeled event set of possible tornado and hailstorm outbreaks, and is calibrated on an ongoing basis with all available loss data. The model considers all three dimensions of tornado clustering – clustering in space, time, and intensity – thereby capturing the full range of extreme events and providing a reliable estimation of SCS risk for regional and nationwide portfolios.
Extending the comparison of the 2011-2020 industry BC and modeled AEL to all other US states, we observe that the BC for most states is notably less than the modeled loss (figure 2c, blue shading). This is because most states did not experience an extreme event within this period, as demonstrated in figure 2b. High excess of loss (XL) and aggregate XL layers of regional portfolios, where there are fewer loss data points and substantial exposures, will be disproportionately exposed to this effect.
Figure 2: (a) The fraction (%) that events with RPs > 10 years (a commonly used BC period) contribute to the long-term CatFocus® modeled industry AEL. (b) RP grouping (RPs according to CatFocus®) of the maximum observed loss from 2011-2020, showing under- (blue) to over- (red) sampled states – only the four red-shaded states (including Alabama) have an extreme event (chosen as RPs > 30 years) in the 2011-2020 BC. (c) Ratio of the 2011-2020 industry BC3 and CatFocus® modeled AEL; the BC for most US states is lower than the model view, blue shading, so the BC is underestimating the long-term risk. Source: PCS2 and PartnerRe.
With exposures spread over multiple US states, nationwide insurers’ BC reported losses generally include some extreme loss causing events. And indeed, the 2011-2020 BC for all US states according to our analysis is approximately USD 27 billion (for 2012-2020, approximately USD 24 billion)2, close to the CatFocus® modeled loss of approximately USD 30 billion; the model value is still higher because it includes modeled, physically reasonable, even costlier events.
A detailed catastrophe model, such as CatFocus®, is therefore needed to reliably estimate SCS risk, especially for regional programs and high XL and aggregate XL layers.
BC and the model view, stronger together
Loss histories (BCs) provide a fast, useful initial risk estimation of SCS risk for US Property non-proportional reinsurance programs, especially for low XL layers where many recent losses are available. They are also invaluable for model calibration. However, in most cases the BC does not represent the full, long-term risk, as extreme events are often not included. Thus, to avoid under or over-estimating the risk to any portfolio, and in particular for regional portfolios and high XL and aggregate XL layers, a reliable long-term model view is essential.
Contributors
Dr. Steffen Münch, Researcher, Catastrophe Research
Dr. Martin Frischknecht, Researcher, Catastrophe Research
Dr. Paul Della Marta, Head of Catastrophe Research
Contact us for more information
If you would like more information on our CatFocus® US Severe Convective Storm model or tornado analysis, please don’t hesitate to get in touch with us, we would be very happy to set up a meeting to discuss this work with you and to help you consider the impacts on your own portfolio.
This article is for general information, education and discussion purposes only and does not constitute legal or professional advice.
2 Property Claims Services (PCS) industry loss estimates, trended to today’s value by PartnerRe using exposure growth data (census.gov) and average claim size changes (PCS). PCS (Property Claims Service), a division of Verisk. Not for distribution without the permission of PCS. For more information, please contact Tom Johansmeyer, [email protected].
3 All PCS losses below USD 25 million are replaced with all CatFocus® losses below USD 25 million (more events) to include missing events and to allow for a more accurate comparison.