We believe you can go further and do more when you have a trusted risk-discussion partner on your team, who will look at your business holistically to uncover new opportunities.
We are a leading global reinsurer that helps insurance companies reduce their earnings volatility, strengthen their capital and grow their businesses through reinsurance solutions.
California Wildfire Risk – Power of the Cat Model for Robust Risk Assessment
SHARE
PartnerRe’s proprietary CatFocus® California Wildfire model previously identified several wildfire events since 1950 with the potential for similarly severe losses as in 2017 and 2018 (given current exposure). In our 2019 article1, the model’s historical event set demonstrated the added value of using cat models for risk assessment over reported losses.
The CatFocus® California Wildfire model has now been updated with a stochastic event set, providing an even more robust view of risk. The stochastic model adds valuable resolution for risk assessment at regional scales and provides a scientifically based estimation of tail risk for the pricing of Property portfolios.
In this 2021 article, we bring together the model’s key features and findings.
Executive summary
The 2017 and 2018 industry losses were the most extreme since 1950, but our proprietary catastrophe model (CatFocus®) shows that several other historical events from this time period would have a similar loss potential if they were to occur today.
The industry should be prepared for future losses of a similar magnitude to 2017 and 2018, and at return periods which significantly impact Property portfolios.
Exposure growth, especially in areas close to wildland, is the main driver of the changing risk landscape for California wildfire. It explains why regions with no prior loss are now also at risk. Non-stationary risk factors, namely recent climate conditions and changes in non-climatic factors (such as forest management and fire suppression practices) have additionally amplified the wildfire risk, especially in forest areas in Northern California.
Given exposure growth and non-stationary risk factors, risk assessment based on historical loss records alone cannot reliably quantify this risk. A catastrophe model is the only viable method.
The CatFocus® California Wildfire catastrophe model provides a reliable benchmark to price California wildfire risk and gives valuable insights into extreme scenarios in the tail of the risk distribution.
CatFocus® estimates that an industry annual aggregate loss of USD 12 billion or higher from California wildfires has a 20-year return period – equivalent to an annual probability of 5%.
The model shows clear differences between Northern and Southern California2:
The modeled historical annual aggregate losses for 2017 and 2018 were the most extreme years for Northern California for the period 1950-2020. For Southern California, the losses from these years are far less extreme.
Modeled annual aggregate losses are higher for Northern California than Southern California at most return periods, though both regions show a significant wildfire risk in the tail of the risk distribution.
Reported and modeled historical losses give very different estimates of risk
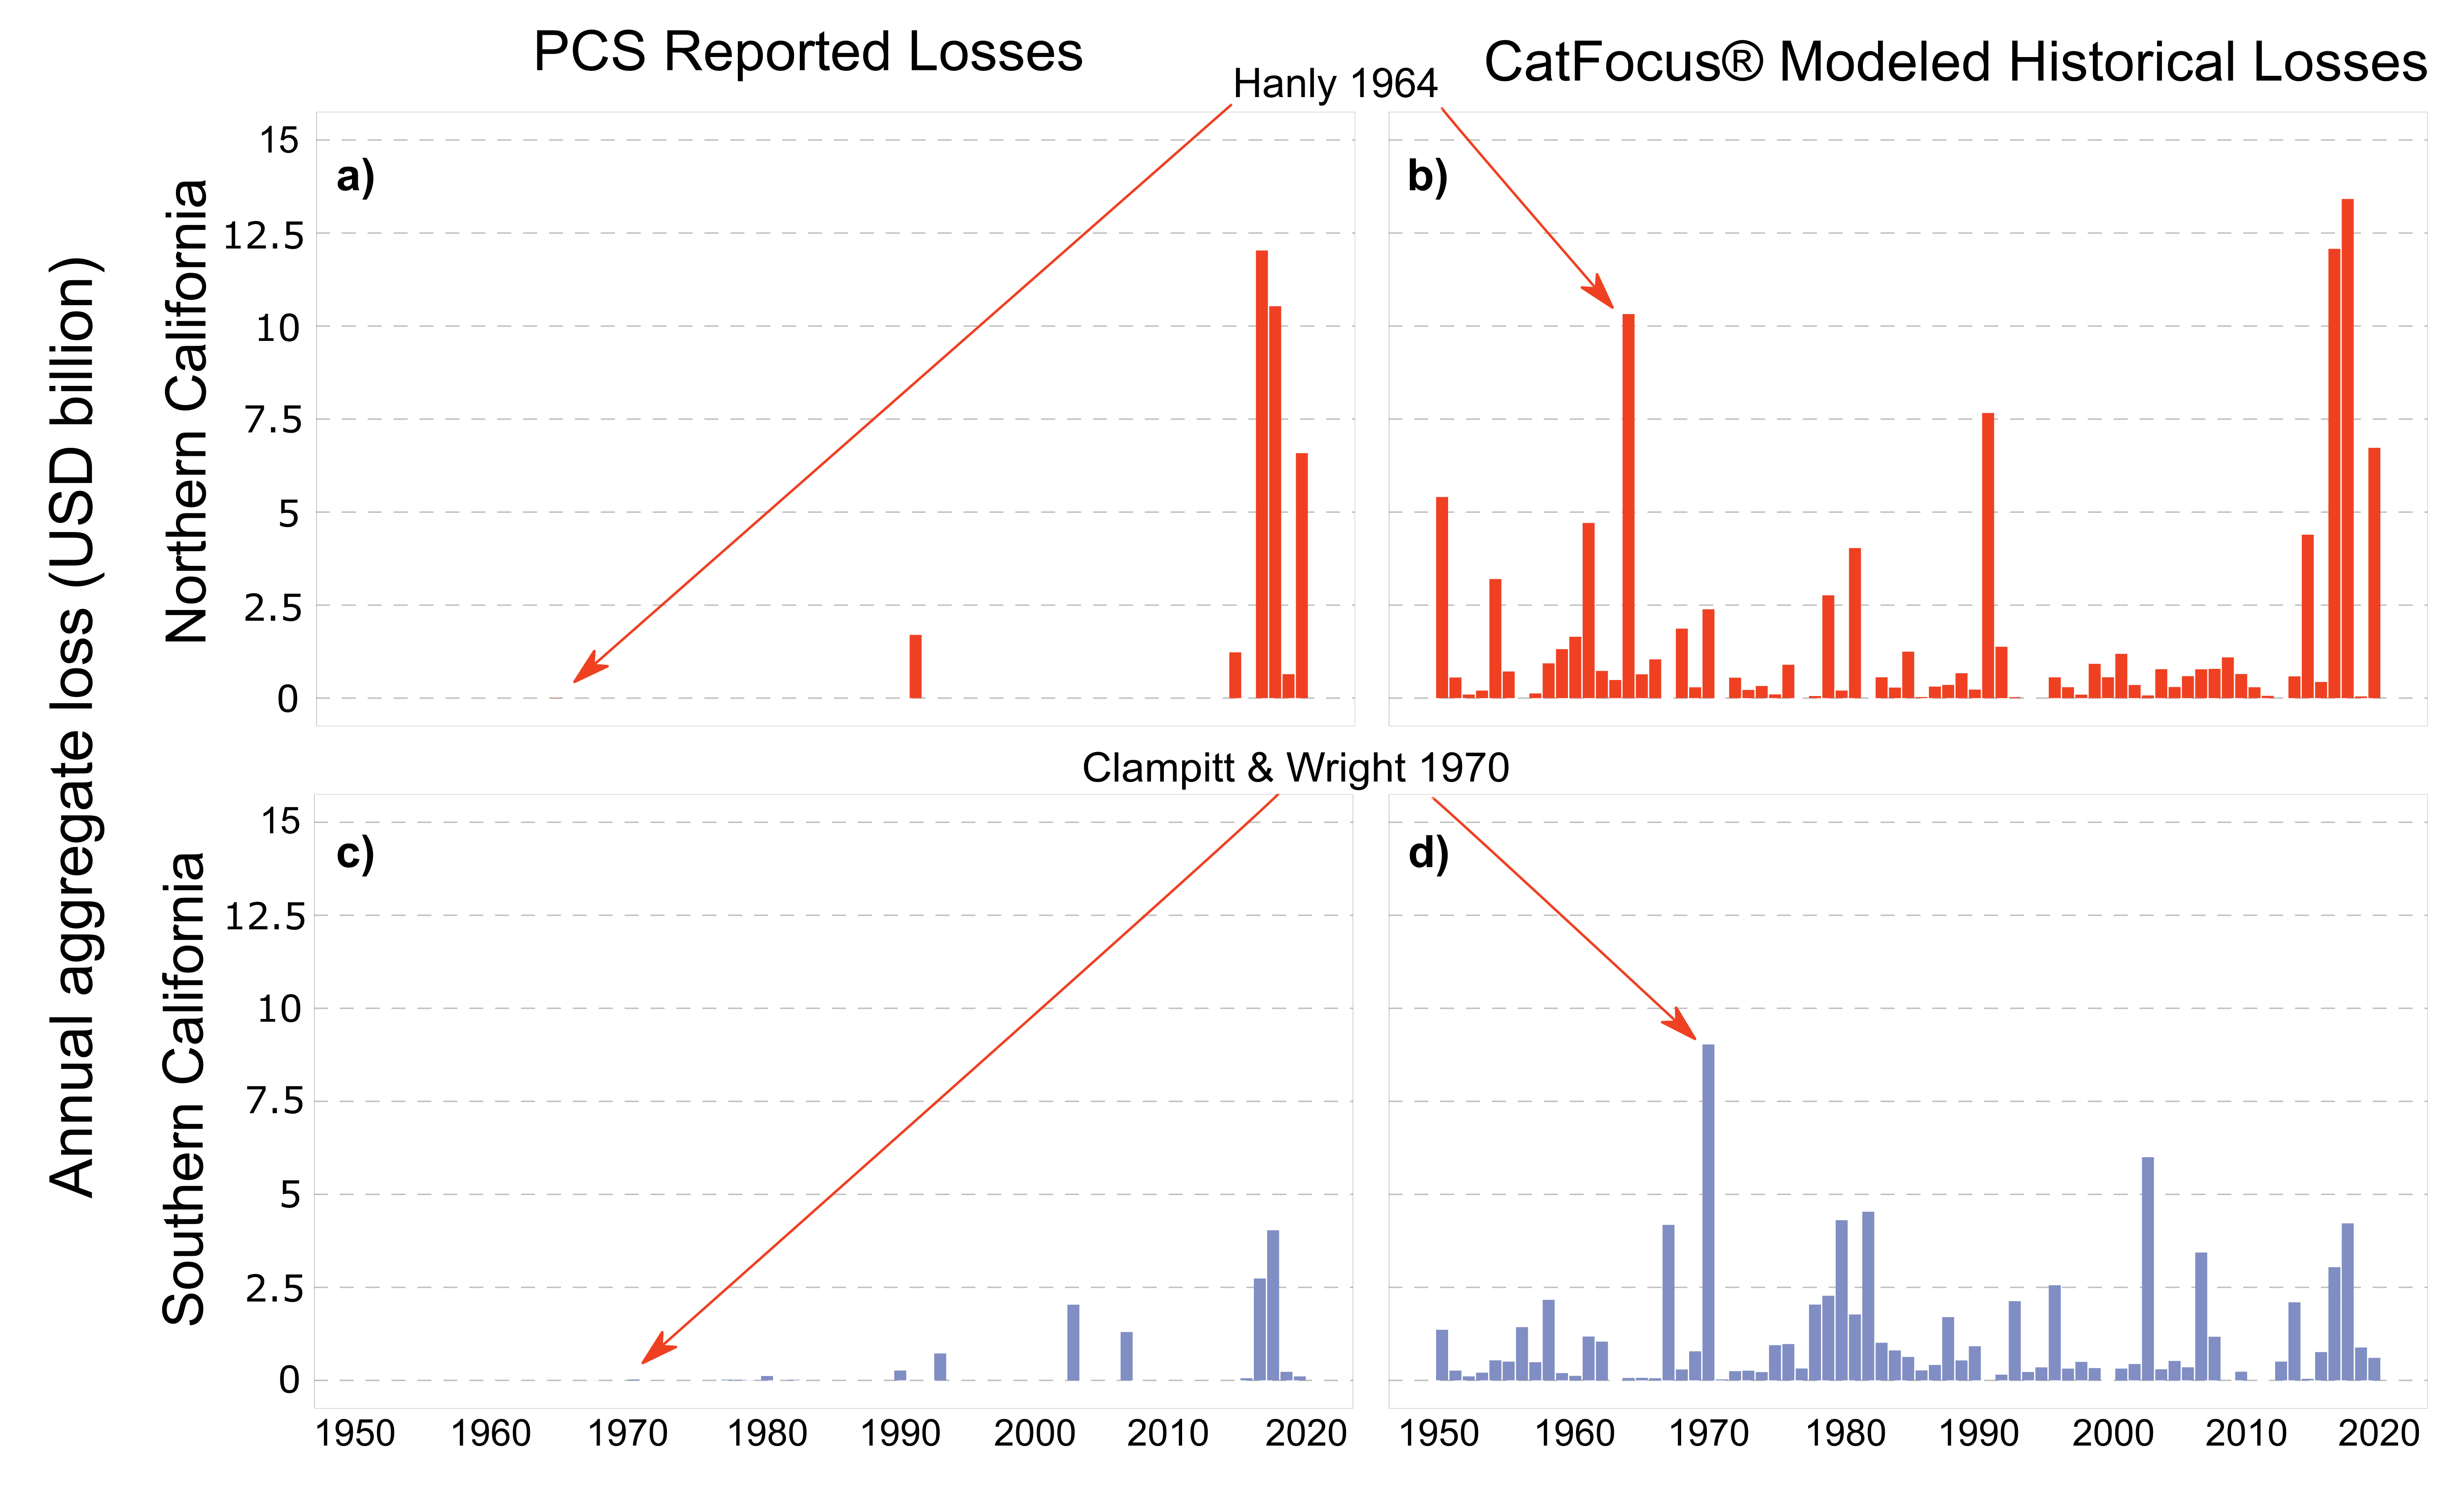
Reported losses California wildfire risk assessment based on reported industry losses (see figure 1a & c, PCS recorded industry losses from 1950 to 20203) indicates that the 2017, 2018 and 2020 losses were extreme, especially in Northern California. There are many years in this time period when no losses exceeded the PCS’s reporting threshold4.
PartnerRe’s catastrophe model In contrast, modeled historical losses from the CatFocus® California Wildfire model (see figure 1b & d) indicate that, using current (2020) industry exposure, many more years in fact had the potential for losses greater than the PCS threshold. Several historical events could have led to losses comparable to or exceeding the magnitude of loss more recently observed in Northern and Southern California (figure 1a & c).
The increase in wildfire risk is mainly due to more people living in wildfire-prone areas
Why are these two estimates of risk so different?
The difference is mainly due to exposure growth driven by:
urban expansion, i.e. changes in where people are living (e.g. from 1990 to 2010, the number of buildings in the wildland-urban interface5 increased from 3.3 to 4.4 million6)
higher population density
increased property values.
This exposure growth has a particularly strong positive and complex, non-linear impact on risk evaluation.
Risk assessments informed by reported losses (which are also often incomplete due to reporting biases) are challenged to adequately and reliably take exposure growth and other risk factor changes into account: if, for example, a historical fire did not affect any properties because the affected area was not populated at the time, it will not be taken into account when estimating current risk. In contrast, catastrophe models can reliably estimate the loss potential of historical fires and therefore provide a different and more complete and current risk estimation.
Figure 1: Annual aggregate reported industry losses in USD billion for (a) Northern and (c) Southern California. Source: PCS3. Modeled historical annual aggregate losses for (b) Northern and (d) Southern California. Source: CatFocus® historical event set, PartnerRe. The difference between reported and modeled historical loss is significant – see also the disparate loss estimates for the Hanly (1964) and Clampitt & Wright (1970) wildfires – and strongly speaks to using robust catastrophe models to assess and evaluate current California wildfire risk. The PCS losses are only those that were reported and which caused an industry loss above the PCS loss threshold4. To ensure comparability with the reported losses, the same (current PCS) threshold is used for the modeled historical losses.
Benefits of a stochastic event set
The historical event set within the CatFocus® California Wildfire model is based on data from the last 71 years and is a reliable benchmark for assessing wildfire risk at the industry level and for large, geographically diversified insurance portfolios.
However, for more heterogeneous exposures – i.e. for smaller or regional portfolios – the spatial and temporal uncertainty associated with sampling from only 71 years is too high for a reliable risk assessment. To accurately price these risks, a more granular spatial and temporal resolution is required. The stochastic event set within the CatFocus® California Wildfire model provides adequate resolution, as it covers 20,000 years and consists of approximately 550,000 simulated wildfire events.
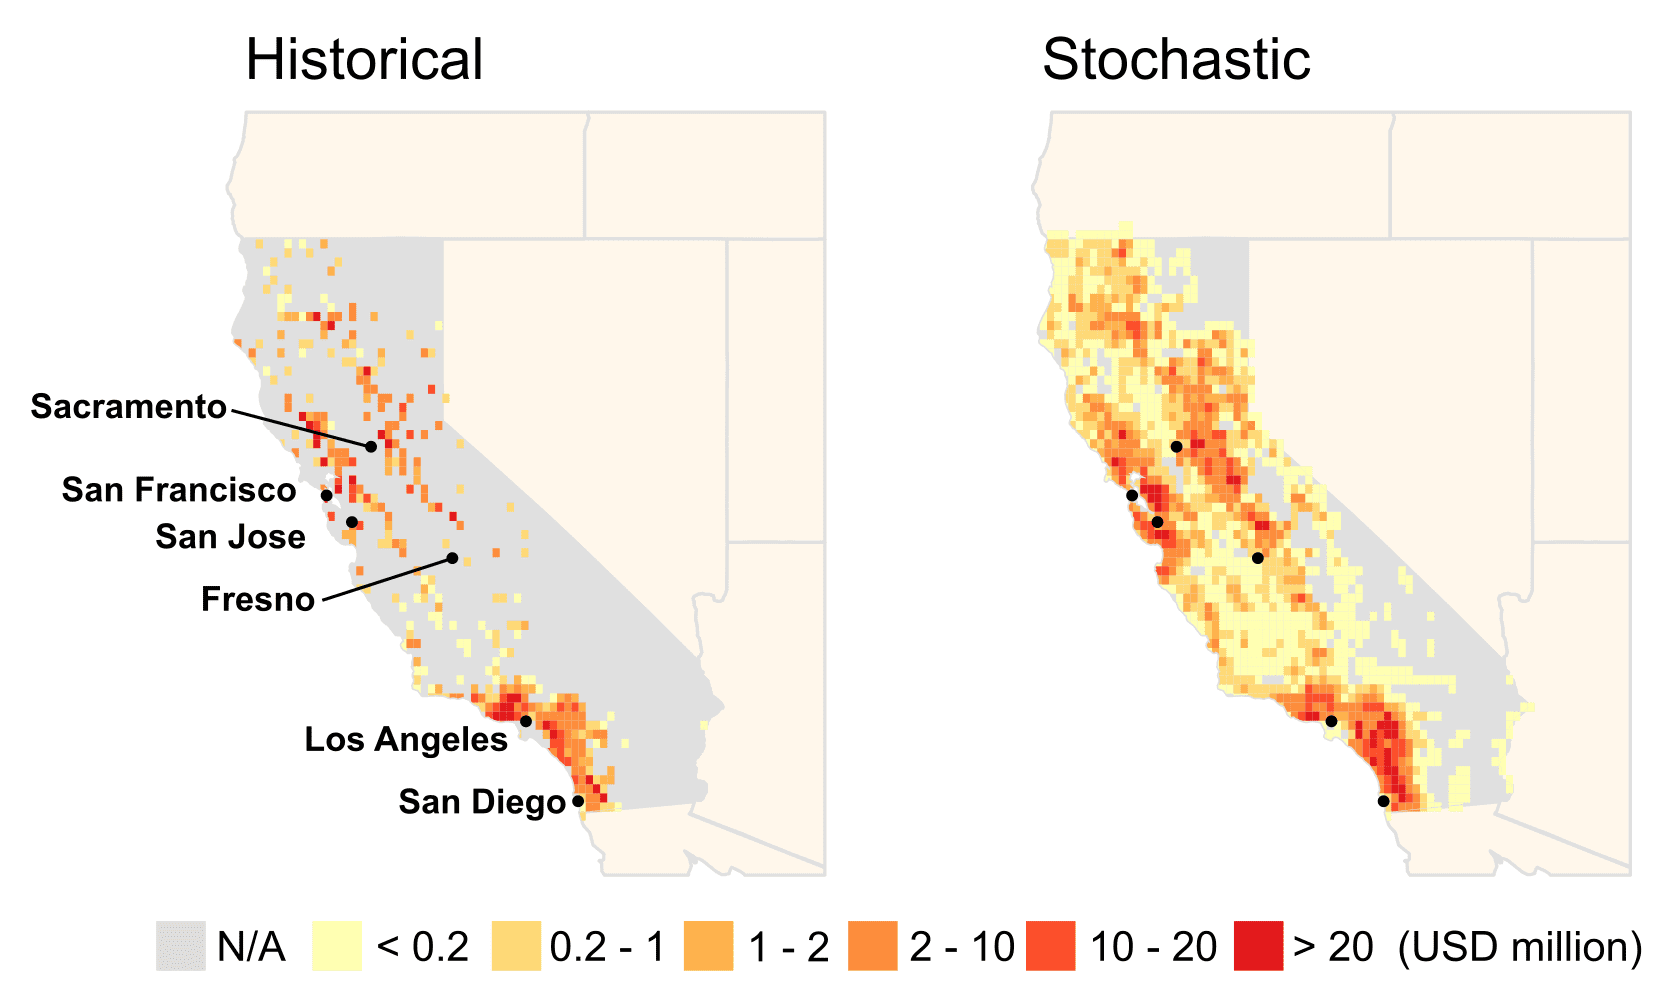
Figure 2 shows the additional granularity and robustness of the modeled annual expected loss (AEL) estimates provided by the model’s stochastic event set (right-hand map) compared to the historical event set (left-hand map).The historical event set shows a much higher AEL volatility between adjacent grid boxes due to the limited sample size. The more granular stochastic event set notably highlights three regions with a significant risk of loss: the south coast around Los Angeles and San Diego, the Bay Area near San Francisco and San Jose, and the forested land of the Greater Sacramento area.
Figure 2: CatFocus® modeled annual expected loss (AEL, in million USD) for California for individual grid points with an area of approximately 250 km2. Values indicate the average risk of insured loss, which is a combination of the hazard (fire severity and its probability of occurrence), presence of insured properties (exposure) and vulnerability of the buildings to fire. Left, based on 1950-2020 modeled historical losses. Right, based on the modeled stochastic event set (simulation length 20,000 years). Both maps distinguish between areas of high (orange to red), low (yellow) and negligible (grey) risk of loss. Areas with zero or negligible risk of loss have minimal fire probability, low exposure, or (in the historical event set) a lack of observations. While the historical event set is a reliable benchmark for risk assessment at the industry level and for large portfolios, the larger sample size of the stochastic event set gives the greater resolution and coverage (reduced sampling variability) needed for a reliable risk assessment of smaller or regional portfolios, as well as for tail risk scenarios. Source: CatFocus®, PartnerRe.
Another benefit of the longer simulation length (higher temporal resolution) of the stochastic event set is that it offers a more robust estimation of tail risk – relevant, for example, for pricing Cat XL reinsurance layers and assessing worst case scenarios. Such events are often without comparable observations from recent history. Tail risk estimation in the stochastic event set is more reliable as it is based on physical parameters, rather than on relatively few historical losses (observed or modeled) that require the risk assessment to be complemented with statistical extrapolation if no comparable observations are available.
A stochastic set also facilitates the closer alignment of risk assessment to current risk factors where these have changed over time (i.e. the risk factors are “non-stationary”). The historical event set assumes that fire frequencies and severities observed in the past would be the same if they were to occur today. Research shows, however, that many factors impacting wildfire risk are non-stationary and have changed in recent decades. For example, our analysis of 1950-2018 historical Californian wildfire activity (based on FRAP data16) indicated a clear upward trend in burned area per year (fire severity), primarily in forested areas in Northern California (in contrast, we observed no significant increase in annual burned area in Southern California, where wildfires more often occur in shrubland). For more information on the causes behind this upward trend, see box below, “Why has fire severity increased?”.
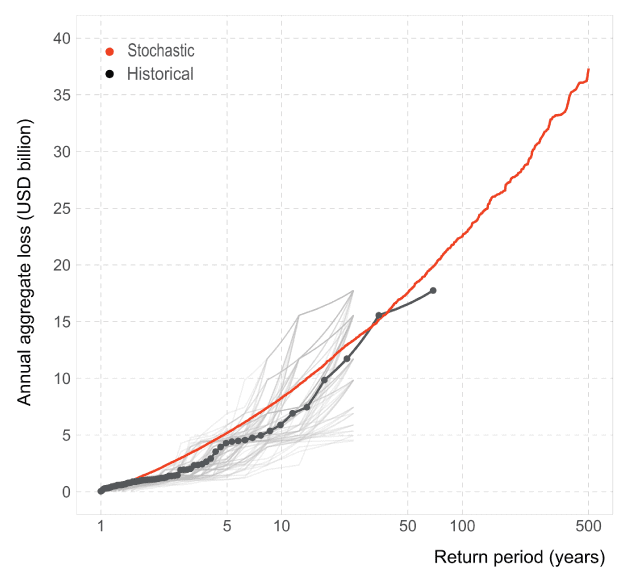
The stationarity assumption for fire severity is therefore not fully justified for Northern California and current fire risk for the region based on historical observation will tend to be underestimated. In contrast, the stochastic event set – conditioned on current climate and vegetation observations (see section, “The CatFocus® California Wildfire Model, Model specifics”) – explicitly accounts for the increased fire severity. In figure 3, the modeled stochastic annual aggregate exceedance probability (AEP) curve for California correspondingly lies above the modeled historical AEP curve at most return periods.
Figure 3: Comparison of the modeled industry annual aggregate loss exceedance probability (AEP) curves for California as a whole, derived from the CatFocus® historical event set (black) and stochastic event set (red). The pale grey lines represent one hundred random 25-year samples from the historical event set, indicating the amount of sampling variability in the historical event set. It can be seen that at return periods below 30 years, the stochastic event set simulates higher annual aggregate industry losses than the historical event set. This is in line with our analysis that identified an upward trend of burned area per year (fire severity) in Northern California in recent decades. Source: CatFocus®, PartnerRe.
Why has fire severity increased?
California’s increased annual burned area in recent years can be linked to many factors, including factors relating to changes in forest health and management, fire management and human interactions7. Over the last century, for example, forest stand density (number of trees per unit area)8 has increased due to fire suppression and management practices over recent decades – this has reduced forest resilience.
Climate variability and climate change9 also play an important role; climate variability is leading to significant inter-annual and inter-decadal fluctuations of the wildfire hazard. Consecutive drought years have a higher likelihood of severe wildfires and wind conditions also significantly alter the risk. In California, the last decade has been abnormally dry – this contributed to a significant bark beetle epidemic that led to the death of an estimated 147 million trees in California’s national forests between 2010 and 201810, adding significant fuel to fires.
Increased tree density combined with extreme drought conditions and the bark beetle epidemic have all contributed to the extreme fire risk in recent years.
Climate change will likely continue to contribute to increasing fire severity. It may also lead to changes in the distribution and abundance of tree species in some areas11. Recent scientific studies12 show that the impact of climate change on Californian wildfire risk varies by region: While the significant increase in summer forest fires (e.g. in Sierra Nevada) is very likely to be linked to climate change, this has not been observed for summer non-forest fires (e.g. in shrublands in Southern California); for autumn fires, which are heavily influenced by strong winds such as Santa Ana and Diablo winds, the impact of climate change to-date appears weak and is uncertain, as these local wind patterns are particularly complex.
Regional differences in wildfire risk
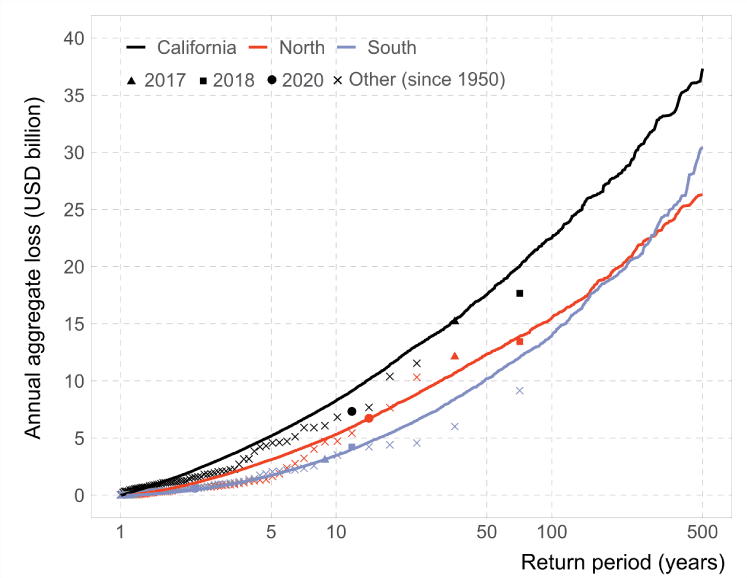
Figure 4 presents the modeled AEP curves for California, and for the Northern and Southern California2 regions based on the historical and stochastic event sets. For Northern California, the higher risk estimation from the stochastic event set compared to the historical set, is in line with our observation of increasing fire severity. For Southern California, where no significant change in fire severity was observed, the stochastic and historical event sets provide a comparable estimation of risk at the industry level.
The modeled results further indicate higher risk for Northern California than Southern California at most return periods (this higher susceptibility to large wildfires is likely due to different fuel types, fire spread and fire suppression aspects), though both regions show a significant and similar wildfire risk in the tail.
Interestingly, there is a difference between the two regions in terms of the contribution to annual aggregate losses from individual events – the annual aggregate loss for Northern California is often dominated by a few events, whereas in Southern California there are more (individually less extreme) events per year, especially in the tail.
Figure 4: Modeled industry annual aggregate loss exceedance probability (AEP) curves for California as a whole, Northern California and Southern California2, based on the stochastic event set (black, red and blue lines) and historical event set (squares, triangles, circles and crosses); the modeled historical annual aggregate losses for 2017 (triangles), 2018 (squares), 2020 (circles) and all other years since 1950 (crosses) are calculated based on the empirical return period. The stochastic event set provides a more robust estimation of current California wildfire risk, especially for Northern California. Source: CatFocus®, PartnerRe.
For California as a whole, CatFocus® estimates that an industry annual aggregate loss of USD 12 billion or higher has an annual probability of 5%; equivalent to a 20-year return period13,14.
For Northern California, CatFocus® indicates that 2017 and 2018 annual aggregate losses:
are extreme with respect to the period 1950-2020
are comparable in modeled loss magnitude to historical wildfire events in 1991 and 1964 (see figure 1c)
have estimated return periods of 50-70 years.
For Southern California, CatFocus® indicates that:
2017 and 2018 losses have much shorter return periods than Northern California, of approximately 10 and 15 years respectively
there are multiple years with the potential to have caused losses equal to or greater than the losses observed in 2017 and 2018 (e.g. 1970, 1982, 2003 and 2007, see figure 1d), given current exposure.
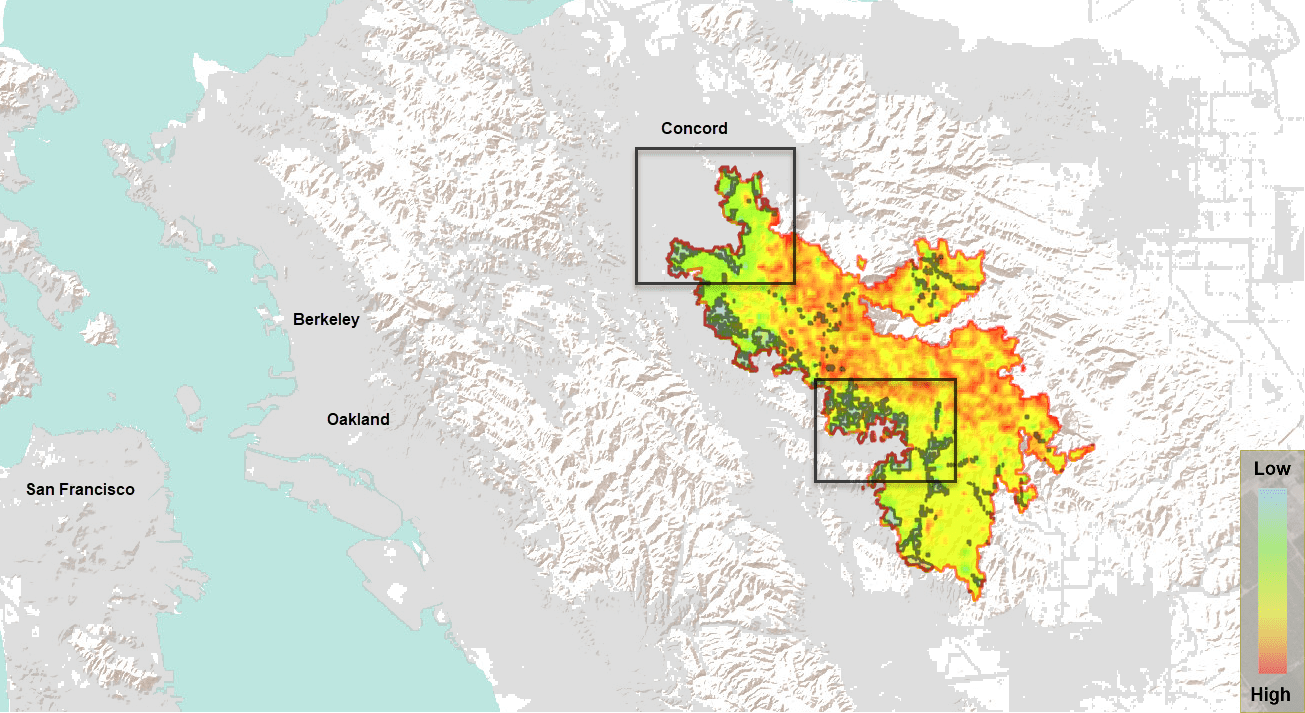
The CatFocus® model also shows that wildfire events close to major urbanizations in both Northern and Southern California, such as San Francisco, Los Angeles, San Diego and Sacramento, are not infrequent and can cause significant losses even from a single event. The 1991 Oakland Hills fire, for example, demonstrated the high loss potential of wildfires in the Bay Area. Simulated wildfire footprints in the CatFocus® model provide insights into other potential events (see example in figure 5), highlighting the issue of high exposure at the wildland-urban interface.
Figure 5: Example wildfire footprint from the modeled stochastic event set with the potential to cause extreme losses in the Bay Area of Northern California. The color scale indicates variations in fire severity within the fire perimeter. Populated areas are shown in light grey, while dark grey lines highlight populated areas impacted by the fire footprint15. This event significantly impacts major urbanizations at the wildland-urban interface, as shown within the two boxed areas. This event’s modeled insured loss estimate exceeds USD 8.5 billion, based on 2020 exposure. Given that the model captures direct fire damage only, this estimate could even be underestimated (see section below, “The CatFocus® California Wildfire model, Limitations and developments”). Source: CatFocus®, PartnerRe16.
Contributors
Luca Weber, Senior Researcher, Catastrophe Research
Dr. Martin Frischknecht, Researcher, Catastrophe Research
Dr. Niklaus Merz, Senior Researcher, Catastrophe Research
Dr. Paul Della-Marta, Head of Catastrophe Research
Read on to find out more about the model itself
The CatFocus® California Wildfire model
Developed by PartnerRe’s catastrophe research, modeling and underwriting experts, the CatFocus® California Wildfire model is a robust catastrophe model which captures the most important factors impacting wildfire risk (namely exposure change, hazard, the broad-scale vulnerability of typical insured residential and commercial property, and insured financial conditions).
Model specifics The model consists of both an historical and a stochastic event set.
The stochastic event set is based on published and scientifically validated fire perimeters generated by the United States Department of Agriculture (USDA)17 using their Fire Simulation model (FSim). FSim simulates the ignition, growth and suppression of wildfires in California over 20,000 years to estimate the frequency distribution of large fire events in space. The FSim simulation process considers the spatial and temporal variation of weather based on recent historical observations, as well as vegetation data and topographic information, and combines this with the probability of fire ignition and factors affecting fire growth and suppression. Using these datasets, the FSim model simulates 20,000 years of potential weather and stochastically models the spatial location and extent of resulting wildfires as they burn across the landscape. Based on these simulated fire perimeters, we derived fire footprints with spatially varying fire severity at 100m resolution. In addition, we post-processed the FSim data to convert the ignition-based event definition to an event definition which aligns with how losses are usually aggregated for reinsurance coverage purposes, resulting in over 550,000 wildfire events in the CatFocus® California Wildfire model.
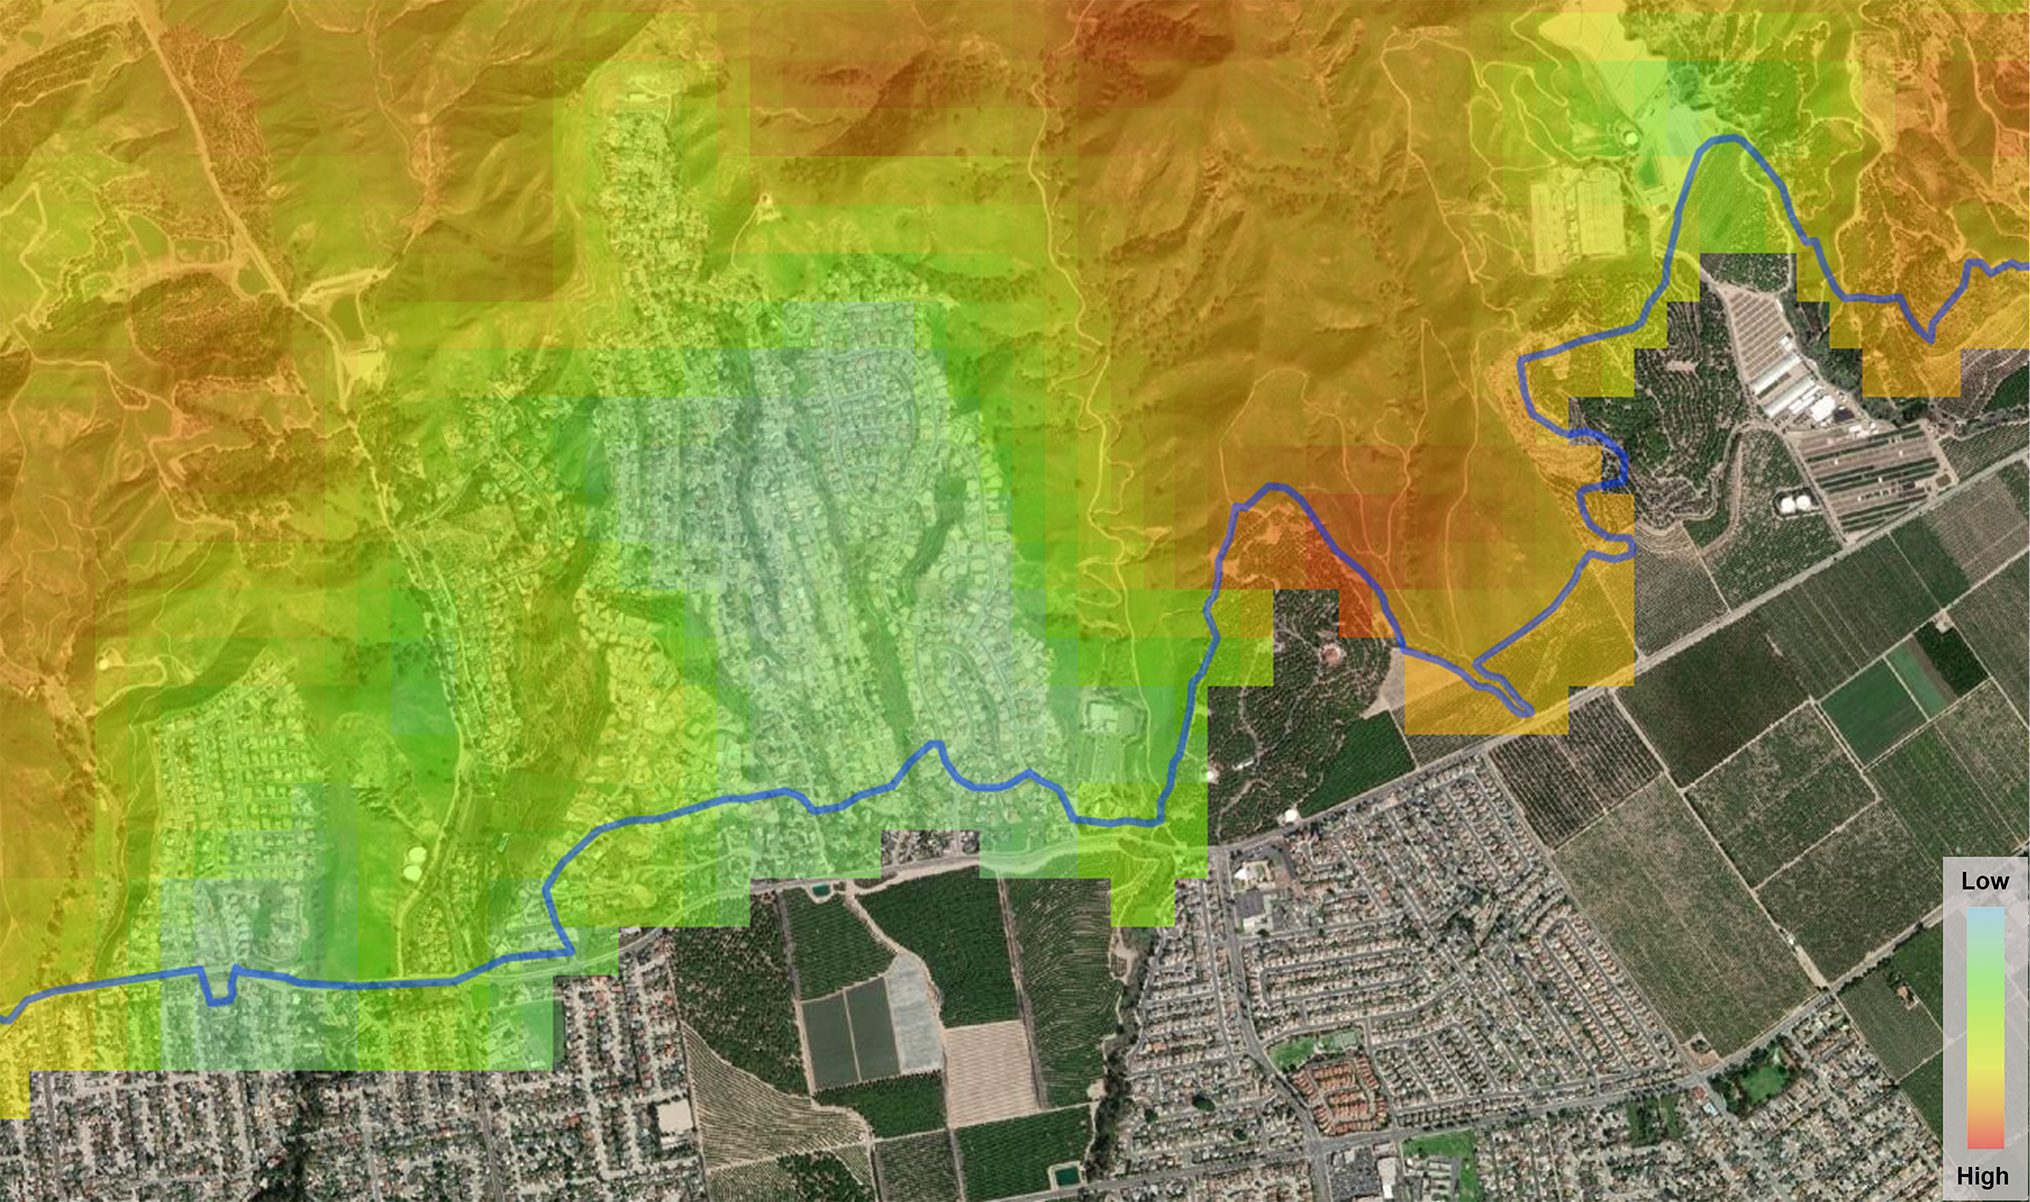
The hazard component in the historical event set is based on historical fire perimeters compiled by the Fire and Resource Assessment Program (FRAP)18 from 1950-2020 for area burned exceeding 300 acres, conditioned with USDA wildfire hazard potential data19. See example wildfire footprint in figure 6.
Figure 6: Example of a wildfire hazard footprint. Transect taken from the Thomas 2017 event in Southern California. The blue line is the FRAP fire perimeter18 and the colors indicate the fire severity (red shaded areas have the highest severity). The property exposure can be seen in the background satellite imagery. Source: CatFocus®, PartnerRe20.
To estimate the ground-up loss in both the historical and stochastic event set, the model combines the hazard with high-resolution exposure information and an estimate of the damage ratio. Since historical losses show that the damage ratios in Northern California are in general higher than in Southern California, the model defines Northern and Southern California as two distinct vulnerability regions2. The CatFocus® financial model then applies the re/insurance financial conditions to calculate the net loss.
The CatFocus® model has been calibrated on 2017 and 2018 industry losses and has been validated on both industry and insurer specific losses. The model captures the impact of exposure growth and exposure reduction well, and is capable of estimating incurred losses to within reasonable measures of accuracy as, for example, was confirmed in 2019 and 2020.
Both event sets have further enabled us to independently assess the impact of subrogation on ultimate losses and to test the sensitivity of different assumptions regarding the frequency and severity of subrogation settlements in reducing the ultimate insurance losses relating to individual events.
Notable variation between insurance portfolios The model allows us to differentiate the risk between different insurance portfolios – to reflect their specific exposure concentrations – and to ascertain portfolio-specific return period ranges for the 2017 and 2018 events (table 1). The model can also identify at-risk regions that have not recently been loss affected.
Portfolio
Northern California
Southern California
2017
2018
2017
2018
Industry exposure
50
70
8
15
A
50
50
4
15
B
40
5
10
30
C
40
10
8
15
Table 1: Modeled return period estimates (in years) for the annual aggregate losses from the 2017 and 2018 events split by region, for the industry exposure and for three sample insurance portfolios. Source: CatFocus®, PartnerRe.
Limitations and developments The model considers the direct impact of fire within the fire perimeter and does not attempt to explicitly incorporate losses from flying embers and indirect causes of damage, e.g. by smoke or soot outside of the fire perimeter. As FSim does not model urban conflagrations, extreme tail events in heavily populated areas could be underestimated. In addition, other non-modeled factors, e.g. fire protection at individual houses, are not reflected in the model. While historical loss data is limited to a few events and years, analysis of detailed claims data could help to refine the approach for modeling direct and indirect damages.
The largest uncertainty in the validation of the model is the separation of multi-annual variability versus long-term change. The historic data and scientific literature clearly show that fire severity has not been stable in recent decades, and that recent years have been particularly damaging. The key questions we would recommend for further investigation by the scientific and catastrophe modeling community are:
How likely is such a sequence of high-loss years (2017, 2018 and 2020) in the long-term perspective?
How representative are past fire conditions for current risk?
To what extent have recent fires and changes in fire management practices already reduced available fuel in the wildland-urban interface and thus altered the wildfire risk compared to 2017-2020?
It is certainly challenging to assess how past fires and current and future forest management practice will impact fuel availability and wildfire risk in coming years. However, it is crucial to do this and to capture such changes in fire conditions. We therefore regularly review and adjust the model to reflect changes in any of the risk factors.
This article is for general information, education and discussion purposes only. It does not constitute legal or professional advice and does not necessarily reflect, in whole or in part, any corporate position, opinion or view of PartnerRe or its affiliates.